Performance testing your services in CI/CD
You’d likely never dream of having a CI/CD pipeline that doesn’t run your unit or integration tests, but performance testing is easily left to the realms of “oh we should test that before we go live” or perhaps “important customer ABC says they’re getting lots of 502 errors”. We can avoid nasty surprises and have conversations backed with data by assessing the performance of our services on each feature branch. All we need is a pipeline that runs load testing automatically. No more finger-in-the-air estimates or “this looks slow” Pull Request comments!
Cost estimation
Before we dive into setting up load testing infrastructure on each feature branch, it’s worth discussing cost. Public clouds bill by usage, including for resources like bandwidth and load balancer compute. This example is a test that runs at approximately 800 requests per second (RPS) at its peak. We’ll need around $40 / month of load balancers at DigitalOcean to be able to handle that many TLS connections, so a test that runs for an hour is about 6 cents for the LB alone.
Take the time to understand your architecture and the cost implications of this kind of testing before you roll it out. If your cloud allows billing breakdowns by resource group, tagging or projects, make sensible choices that allow you to pin down the cost of each performance test after the fact.
Like for like - is your testing realistic?
Test on instances or hosting infrastructure that is as close as possible to your real production environment. Code running directly on a virtual machine would be a poor choice if, when running for real, you’re using containers with an orchestration layer that measure and limits compute resources.
We’re using the same load balancer that would be selected for this project when deployed in production, which ensures that we’re testing the full end-to- end flow that a real user would have.
Architecture
This example deploys infrastructure on DigitalOcean, purely as a simple way of getting started. You’ll have to adapt it to suit your use case, be that a different cloud or deployment method, e.g. containers. We’ll use GitHub actions as our CI/CD, Terraform to deploy infrastructure, Ansible to configure the instances and deploy code and finally Gatling for the load testing.
Once instance will be used to run the service, one instance will be used to load test it and a managed database product for PostgreSQL will act as the database. AWS icons are used here for ease.
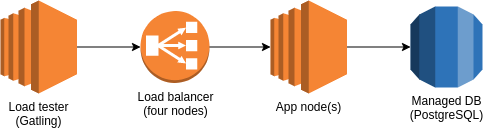
For the app service itself, we’ll be using NestJS with class-validator for request validation, pgtyped for delightful database querying and fastify for the “HTTP stuff”. Logging will be performed by pino.
NB: logging and the required serialisation can be incredibly expensive in NodeJS applications. Choose your logging library carefully. Run ambitious load tests and view flamegraphs made by 0x as part of your development. Wouldn’t it be nice if this example was updated to run 0x and automatically upload the results for your team-mates easy viewing?
Pipelines - an exercise in patience
Our goal pipeline looks as follows:
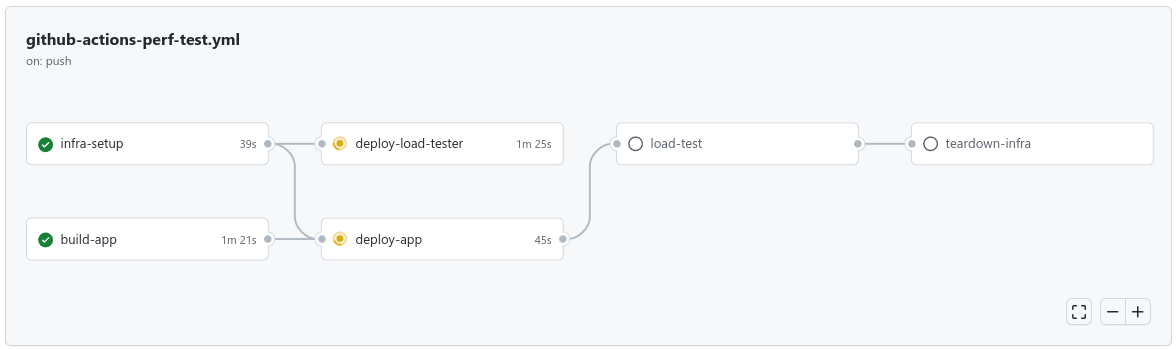
We’ll store our deployment scripts (Ansible playbooks) in the app’s project, and we’ll use git submodules to pull in the performance testing code which will live in a separate repo. The layout of repos is up to you - this is just one approach.
Infrastructure - somewhere for the code to go
One of our first jobs, “infra-setup” above, is to deploy the infrastructure we’ll need with Terraform. Your GitHub Actions job for that might look something like this:
jobs:
  infra-setup:
    name: 'infra-setup'
    runs-on: ubuntu-20.04

    # Use a decent shell and move into the directory we're using for Terraform code
    defaults:
      run:
        shell: bash
        working-directory: infra

    # Ensure we have the tokens required to do the AWS authentication with OIDC
    permissions:
      contents: read
      id-token: write

    # Our main cloud provider is DO so we need auth for that - AWS is just used for Terraform state
    env:
      DIGITALOCEAN_TOKEN: $

    steps:
      - name: Checkout
        uses: actions/checkout@v2

      - name: Setup Terraform
        uses: hashicorp/setup-terraform@v1
        with:
          terraform_version: 1.1.9

      # Only used for Terraform remote state - this is a lovely action and you should use it
      - name: Authenticate with AWS
        uses: aws-actions/configure-aws-credentials@v1
        with:
          role-to-assume: arn:aws:iam::12345678901:role/github-actions
          aws-region: eu-west-1

      # We use workspaces to allow multiple branches concurrently
      - name: Terraform init
        run: |
          terraform init && \
          terraform workspace select "nodebeer-$GITHUB_REF_NAME" || terraform workspace new "nodebeer-$GITHUB_REF_NAME"

      - name: Terraform format check
        run: terraform fmt -check

      - name: Terraform plan
        run: terraform plan -var "env=$GITHUB_REF_NAME" -out plan

      # Deploy our infrastructure
      - name: Terraform apply
        run: terraform apply plan
There’s nothing special about the Terraform code required - it’s just a load balancer attached to an instance with a standalone instance for load testing.
Code - the thing developers do
Once we’ve got some instances, we can deploy the code to them with another GitHub Actions job:
jobs:
  deploy-app:
    name: deploy-app
    runs-on: ubuntu-20.04

    # Build a beautiful graph of pipeline dependencies
    # This is the most fun you'll have in DevOps so may as well make the most of it
    needs:
      - infra-setup
      - build-app

    # Similar job here to use the subdirectory for Ansible playbooks
    defaults:
      run:
        shell: bash
        working-directory: deploy

    # Again required only for our AWS-powered Terraform remote state storage
    permissions:
      contents: read
      id-token: write

    steps:
      - name: Checkout
        uses: actions/checkout@v2

      # The "build-app" stage isn't very interesting, but it's shown after this one
      - name: Download app package
        uses: actions/download-artifact@v3
        with:
          name: app
          path: deploy/files

      - name: Install Ansible
        run: |
          sudo apt install --yes software-properties-common && \
          sudo add-apt-repository --yes --update ppa:ansible/ansible && \
          sudo apt install --yes ansible

      # Printing out the version is handy when we're being a bit naughty and not pinning it above
      - name: Ansible-playbook version check
        run: ansible-playbook --version

      # We'll need some means of connecting to the instances, so we're using ssh-agent
      - name: Setup SSH key
        uses: webfactory/ssh-agent@fc49353b67b2b7c1e0e6a600572d01a69f2672dd
        with:
          ssh-private-key: $

      # Only required to read state outputs
      - name: Setup Terraform
        uses: hashicorp/setup-terraform@v1
        with:
          terraform_version: 1.1.9

      - name: Authenticate with AWS
        uses: aws-actions/configure-aws-credentials@v1
        with:
          role-to-assume: arn:aws:iam::169549429764:role/github-actions
          aws-region: eu-west-1

      # Generate some variable files for Ansible using Terraform's state
      # This lets us know where to deploy the code and how to run migrations etc
      - name: Setup Ansible vars and inventory
        run: |
          terraform init && \
          terraform workspace select "nodebeer-$GITHUB_REF_NAME" || terraform workspace new "nodebeer-$GITHUB_REF_NAME" && \
          terraform-bin output --raw app_node_ips > ../deploy/inventory && \
          echo -e "---\ndb_host: \"$(terraform-bin output --raw db_host)\"\ndb_name: \"$(terraform-bin output --raw db_name)\"\ndb_user: \"$(terraform-bin output --raw db_user)\"\ndb_pass: \"$(terraform-bin output --raw db_pass)\"\ndb_port: $(terraform-bin output --raw db_port)" > ../deploy/dynamic_vars.yml && \
          echo -e "flyway.url=jdbc:postgresql://$(terraform-bin output --raw db_external_host):$(terraform-bin output --raw db_port)/$(terraform-bin output --raw db_name)\nflyway.user=$(terraform-bin output --raw db_user)\nflyway.password=$(terraform-bin output --raw db_pass)\nflyway.connectRetries=2\nflyway.locations=filesystem:../flyway/sql" > ../deploy/flyway.conf
        working-directory: infra

      # The config for Flyway is setup above and now we'll apply DB migrations before we start our load testing
      # At this stage, you'd normally also feed in a good chunk of test data
      - name: Install Flyway
        run: cd /tmp && wget -qO- https://repo1.maven.org/maven2/org/flywaydb/flyway-commandline/8.5.10/flyway-commandline-8.5.10-linux-x64.tar.gz | tar xvz && sudo ln -s `pwd`/flyway-8.5.10/flyway /usr/local/bin && cd $GITHUB_WORKSPACE

      - name: Run migrations
        run: flyway -configFiles=flyway.conf migrate

      - name: Deploy app
        run: ansible-playbook -i inventory playbook-app.yml
The “build-app” stage is pretty bog-standard for NodeJS:
jobs:
  build-app:
    name: build-app
    runs-on: ubuntu-20.04

    defaults:
      run:
        shell: bash

    env:
      NODE_ENV: production

    services:
      # DB for "pgtyped"
      postgres:
        image: postgres:14
        env:
          POSTGRES_PASSWORD: example
        # Set health checks to wait until postgres has started
        ports:
          - 5432:5432
        options: >-
          --health-cmd pg_isready
          --health-interval 10s
          --health-timeout 5s
          --health-retries 5

    steps:
      - name: Checkout
        uses: actions/checkout@v3

      - name: Install Flyway
        run: cd /tmp && wget -qO- https://repo1.maven.org/maven2/org/flywaydb/flyway-commandline/8.5.10/flyway-commandline-8.5.10-linux-x64.tar.gz | tar xvz && sudo ln -s `pwd`/flyway-8.5.10/flyway /usr/local/bin && cd $GITHUB_WORKSPACE

      - name: Run migrations
        run: flyway -url=jdbc:postgresql://localhost/postgres -user=postgres -password=example -connectRetries=2 -locations=filesystem:flyway/sql migrate

      - name: Setup NodeJS
        uses: actions/setup-node@v3
        with:
          node-version: 18

      - name: Install dependencies
        run: NODE_ENV=development npm ci

      - name: Build app
        run: npm run pgtyped && npm run build

      - name: Clean dependencies
        run: npm ci

      # Make a nice tarball to transport our code to the deployment build stage
      - name: Package
        run: tar -cf service.tar.gz dist flyway package.json package-lock.json pgtyped.json

      - name: Upload package
        uses: actions/upload-artifact@v3
        with:
          name: app
          path: service.tar.gz
The Ansible playbooks create some unprivileged users to run our code, setup NodeJS / Gatling and perform updates. There are a plethora of other options available, including good old shell scripts, Puppet, Salt Stack, etc. The “deploy-load-tester” job looks near-identical to the one for “deploy-app”, so it’s not included here.
The results
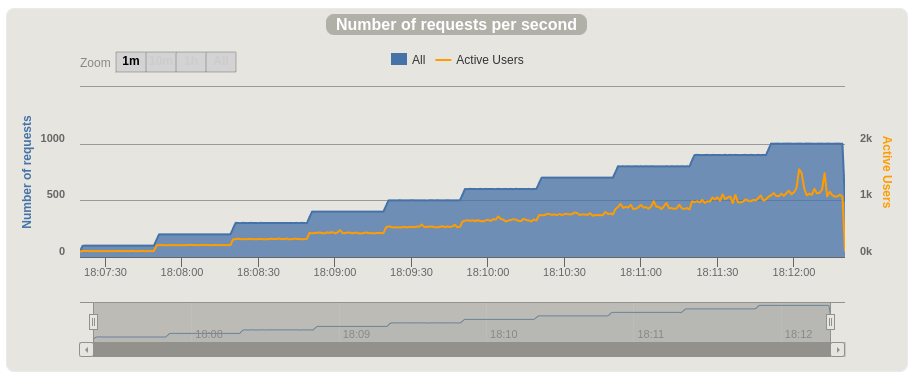
After we’ve setup our service infrastructure and deployed our code, we’ll need to run our Gatling load test. We’re using a very simple simulation that gradually ramps up RPS for about five minutes:
public class NodeJSPerfTesting extends Simulation {

    // A scenario is a chain of requests and pauses
    ScenarioBuilder scn =
            scenario("Scenario Name")
                    .exec(http("request_1").post("/").body(StringBody("...")).header("Content-Type", "application/json"));

    {
        setUp(
                scn.injectOpen(
                        constantUsersPerSec(100).during(30),
                        constantUsersPerSec(200).during(30),
                        constantUsersPerSec(300).during(30),
                        constantUsersPerSec(400).during(30),
                        constantUsersPerSec(500).during(30),
                        constantUsersPerSec(600).during(30),
                        constantUsersPerSec(700).during(30),
                        constantUsersPerSec(800).during(30),
                        constantUsersPerSec(900).during(30),
                        constantUsersPerSec(1000).during(30)
                )
        ).protocols(httpProtocol);
    }
}
The CI job that runs Gatling uploads the files from our performance testing repo, runs Gatling and then compresses the results ready to be uploaded as an artifact.
jobs:
load-test:
name: load-test
runs-on: ubuntu-20.04
needs:
- deploy-app
defaults:
run:
shell: bash
permissions:
contents: read
id-token: write
steps:
- name: Checkout main repo
uses: actions/checkout@v3
- name: Setup SSH key
uses: webfactory/ssh-agent@fc49353b67b2b7c1e0e6a600572d01a69f2672dd
with:
ssh-private-key: $
- name: Setup Terraform
uses: hashicorp/setup-terraform@v1
with:
terraform_version: 1.1.9
- name: Authenticate with AWS
uses: aws-actions/configure-aws-credentials@v1
with:
role-to-assume: arn:aws:iam::169549429764:role/github-actions
aws-region: eu-west-1
- name: Run load test
run: |
terraform init && \
terraform workspace select "nodebeer-$GITHUB_REF_NAME" || terraform workspace new "nodebeer-$GITHUB_REF_NAME" && \
ssh -o StrictHostKeyChecking=no service@$(terraform-bin output --raw load_tester_node_ip) run-load-test $GITHUB_RUN_NUMBER
working-directory: infra
- name: Download results from box
run: rsync -e "ssh -o StrictHostKeyChecking=no" -avh service@$(terraform-bin output --raw load_tester_node_ip):results.tar.gz ../
working-directory: infra
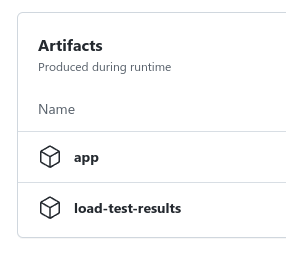
- name: Upload results to GitHub
uses: actions/upload-artifact@v3
with:
name: load-test-results
path: results.tar.gz
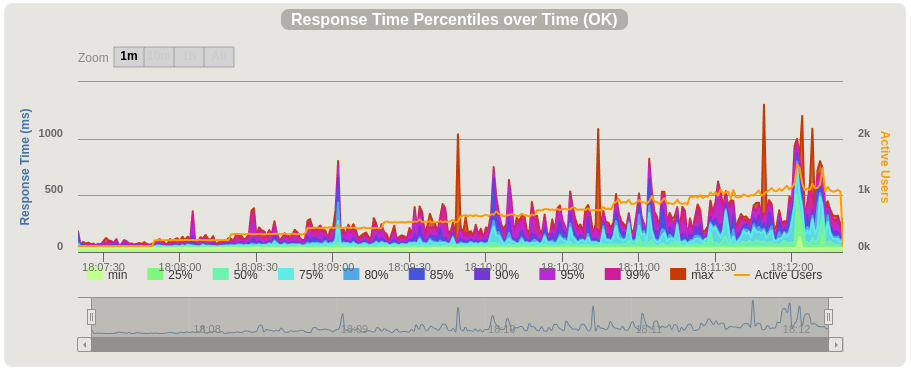
Once Gatling has finished, we get the results tarball uploaded to our job for easy access. We could go even further and have the build fail if the changes cause our performance to drop below a defined threshold. Even in its current form, we can now have productive and data-driven discussions about performance before any changes are merged.
Gatling captures a number of charts showing how our service performed, and how hard we were pushing it over time. Here are two examples displaying requests per second and accompanying:
Full example code
That’s it for today! Checkout the GitHub projects linked below for the full code.
These repos are named “nodejs-beer” as they were born out of a discussion with an exceptional ex-colleague of mine who, after losing a small performance related bet, now owes me a beer. I’m still waiting to collect on that one…
- App code, Ansible, Terraform: nodejs-beer-performance
- Gatling simulations: nodejs-beer-performance-test
NB: the infrastructure contained in the above repos is a quick-and-dirty example. It’s nowhere near as secure as what you should aim for when you roll this out with your team.