Visualising ALB logs with Elasticsearch and Kibana
Having the raw logs from our AWS Application Load Balancer can be really helpful for debugging, especially when the service that you’re load balancing may not have logged a message if it times out or otherwise errors. If you’ve spent any time writing NodeJS services with Express and Promises, I’m sure you’ll have run into the controller or middleware that you’re writing having an unhandled promise rejection and not returning any response to the user. These are hard errors to catch if your request logging middleware logs only after the request has finished, as no log message appears even when the error occurs.
A quick note about CloudWatch Metrics
Although this blog post describes a method of having the access logs end up in Elasticsearch, I’d always recommend using the available CW metrics for the target groups and ALB itself to alarm on the error rates, response times and request counts for your load balancer going above an appropriate threshold. You may have existing alerting that is powered by Elasticsearch data, but the delay between the requests having been made and the log data arriving in ES means that your response time will be much higher when relying on this ingested data. These steps also add a point of failure between an error occurring and you being notified.
The architecture
We’re going to have our Application Load Balancer send access logs to an S3 bucket. When they arrive, we’ll use a notification to trigger a Lambda function which will parse the log data and then insert it into Elasticsearch through the ES bulk API. An example Lambda function is available in this repository, but you may want to tweak it to use a different log destination, for example LogStash.
Log format and the destination bucket
Follow the guide on this AWS tutorial to create a bucket for and turn on ALB access logging. Alternatively, use the example Terraform configuration as a starting point for automating the creation of the required infrastructure. Once switched on, verify that the log data arrives and, if you used the Terraform configuration, the Lambda function is being executed. Logs are only delivered once every 5 minutes and so it may take some time for the first files to arrive. Confirm the files have been placed into the bucket and then move on to setting up the Lambda function.
The Lambda function
We’re going to use a really small Lambda function written in TypeScript to parse our log data and then send it to Elasticsearch. We’ll batch up the data and use the bulk API to send the data in a smaller number of requests. Take care with the memory size and timeout you set for the Lambda as parsing the data and having ES ingest it may take some time. This is especially important if you’re testing the log ingestion in a development environment where you’ll likely see much much smaller log files that are quicker to parse and index.
The Lambda function begins by downloading and decompressing the incoming file.
It then goes through each line and parses it with the log format that’s shown in
the ALB documentation, before chunking the parsed log data into sets of 500
documents and then indexing them into ES. The parsing code is fairly verbose to
keep it type safe and have specific logic for fields that may not contain a
value (turning the data into null). You can adapt it to match how you’d like
to store the data, or to avoid indexing fields that you don’t find relevant.
When indexed, the documents look like the following example:
{
    "_index": "alb-access-logs-2019.05.28",
    "_type": "_doc",
    "_id": "1-5ced64b9-18606eda8c95df56fa43d5a1",
    "_score": 1,
    "_source": {
      "receivedBytes": 313,
      "request": "POST http://54.194.97.95:80/sheep.php HTTP/1.1",
      "requestCreationTime": "2019-05-28T16:41:29.343000Z",
      "redirectUrl": null,
      "targetGroupArn": "arn:aws:elasticloadbalancing:eu-west-1:247940857651:targetgroup/alb/fe1499ac86c7fe07",
      "type": "http",
      "targetPort": 80,
      "responseProcessingTime": 0,
      "targetProcessingTime": 0,
      "chosenCertArn": null,
      "matchedRulePriority": 0,
      "actionsExecuted": [
        "forward"
      ],
      "errorReason": null,
      "clientPort": 14202,
      "elb": "app/alb/440f5d0d96de415d",
      "timestamp": "2019-05-28T16:41:29.345172Z",
      "traceId": "Root=1-5ced64b9-18606eda8c95df56fa43d5a1",
      "sslCipher": null,
      "geoip": {
        "continent_name": "Asia",
        "city_name": "Beijing",
        "country_iso_code": "CN",
        "region_name": "Beijing",
        "location": {
          "lon": 116.3883,
          "lat": 39.9289
        }
      },
      "userAgent": "Mozilla/5.0 (Windows NT 10.0; Win64; x64) AppleWebKit/537.36 (KHTML, like Gecko) Chrome/68.0.3440.106 Safari/537.36",
      "requestProcessingTime": 0,
      "targetIp": "10.0.5.18",
      "targetStatusCode": 404,
      "clientIp": "132.232.31.167",
      "domainName": null,
      "elbStatusCode": 404,
      "sslProtocol": null,
      "sentBytes": 3843
    }
}
The _id field uses the trace ID that was provided by the load balancer and
lets us reprocess log files without duplicate data appearing. In order to have
the correct data types for the indexes created as part of the log ingestion,
we’ll create an index template:
PUT http://elasticsearch/_template/alb-access-logs
{
  "index_patterns": "alb-access-logs-*",
  "mappings": {
    "_doc": {
      "properties": {
        "actionsExecuted": {
          "type": "text",
          "fields": {
            "keyword": {
              "type": "keyword",
              "ignore_above": 256
            }
          }
        },
        "chosenCertArn": {
          "type": "text",
          "fields": {
            "keyword": {
              "type": "keyword",
              "ignore_above": 256
            }
          }
        },
        "clientIp": {
          "type": "text",
          "fields": {
            "keyword": {
              "type": "keyword",
              "ignore_above": 256
            }
          }
        },
        "clientPort": {
          "type": "long"
        },
        "domainName": {
          "type": "text",
          "fields": {
            "keyword": {
              "type": "keyword",
              "ignore_above": 256
            }
          }
        },
        "elb": {
          "type": "text",
          "fields": {
            "keyword": {
              "type": "keyword",
              "ignore_above": 256
            }
          }
        },
        "elbStatusCode": {
          "type": "long"
        },
        "geoip": {
          "properties": {
            "city_name": {
              "type": "text",
              "fields": {
                "keyword": {
                  "type": "keyword",
                  "ignore_above": 256
                }
              }
            },
            "continent_name": {
              "type": "text",
              "fields": {
                "keyword": {
                  "type": "keyword",
                  "ignore_above": 256
                }
              }
            },
            "country_iso_code": {
              "type": "text",
              "fields": {
                "keyword": {
                  "type": "keyword",
                  "ignore_above": 256
                }
              }
            },
            "location": {
              "type": "geo_point"
            },
            "region_name": {
              "type": "text",
              "fields": {
                "keyword": {
                  "type": "keyword",
                  "ignore_above": 256
                }
              }
            }
          }
        },
        "matchedRulePriority": {
          "type": "long"
        },
        "receivedBytes": {
          "type": "long"
        },
        "request": {
          "type": "text",
          "fields": {
            "keyword": {
              "type": "keyword",
              "ignore_above": 256
            }
          }
        },
        "requestCreationTime": {
          "type": "date"
        },
        "requestProcessingTime": {
          "type": "long"
        },
        "responseProcessingTime": {
          "type": "long"
        },
        "sentBytes": {
          "type": "long"
        },
        "sslCipher": {
          "type": "text",
          "fields": {
            "keyword": {
              "type": "keyword",
              "ignore_above": 256
            }
          }
        },
        "sslProtocol": {
          "type": "text",
          "fields": {
            "keyword": {
              "type": "keyword",
              "ignore_above": 256
            }
          }
        },
        "targetGroupArn": {
          "type": "text",
          "fields": {
            "keyword": {
              "type": "keyword",
              "ignore_above": 256
            }
          }
        },
        "targetIp": {
          "type": "text",
          "fields": {
            "keyword": {
              "type": "keyword",
              "ignore_above": 256
            }
          }
        },
        "targetPort": {
          "type": "long"
        },
        "targetProcessingTime": {
          "type": "long"
        },
        "targetStatusCode": {
          "type": "long"
        },
        "timestamp": {
          "type": "date"
        },
        "traceId": {
          "type": "text",
          "fields": {
            "keyword": {
              "type": "keyword",
              "ignore_above": 256
            }
          }
        },
        "type": {
          "type": "text",
          "fields": {
            "keyword": {
              "type": "keyword",
              "ignore_above": 256
            }
          }
        },
        "userAgent": {
          "type": "text",
          "fields": {
            "keyword": {
              "type": "keyword",
              "ignore_above": 256
            }
          }
        }
      }
    }
  }
}
The Lambda function also relies on a pipeline that will convert the client IP address into a latitude and longitude with the Ingest geoip Processor Plugin.
PUT http://elasticsearch/_ingest/pipeline/aws-alb-logs
{
  "description" : "Add geoip info",
  "processors" : [
    {
      "geoip" : {
        "field" : "clientIp"
      }
    }
  ]
}
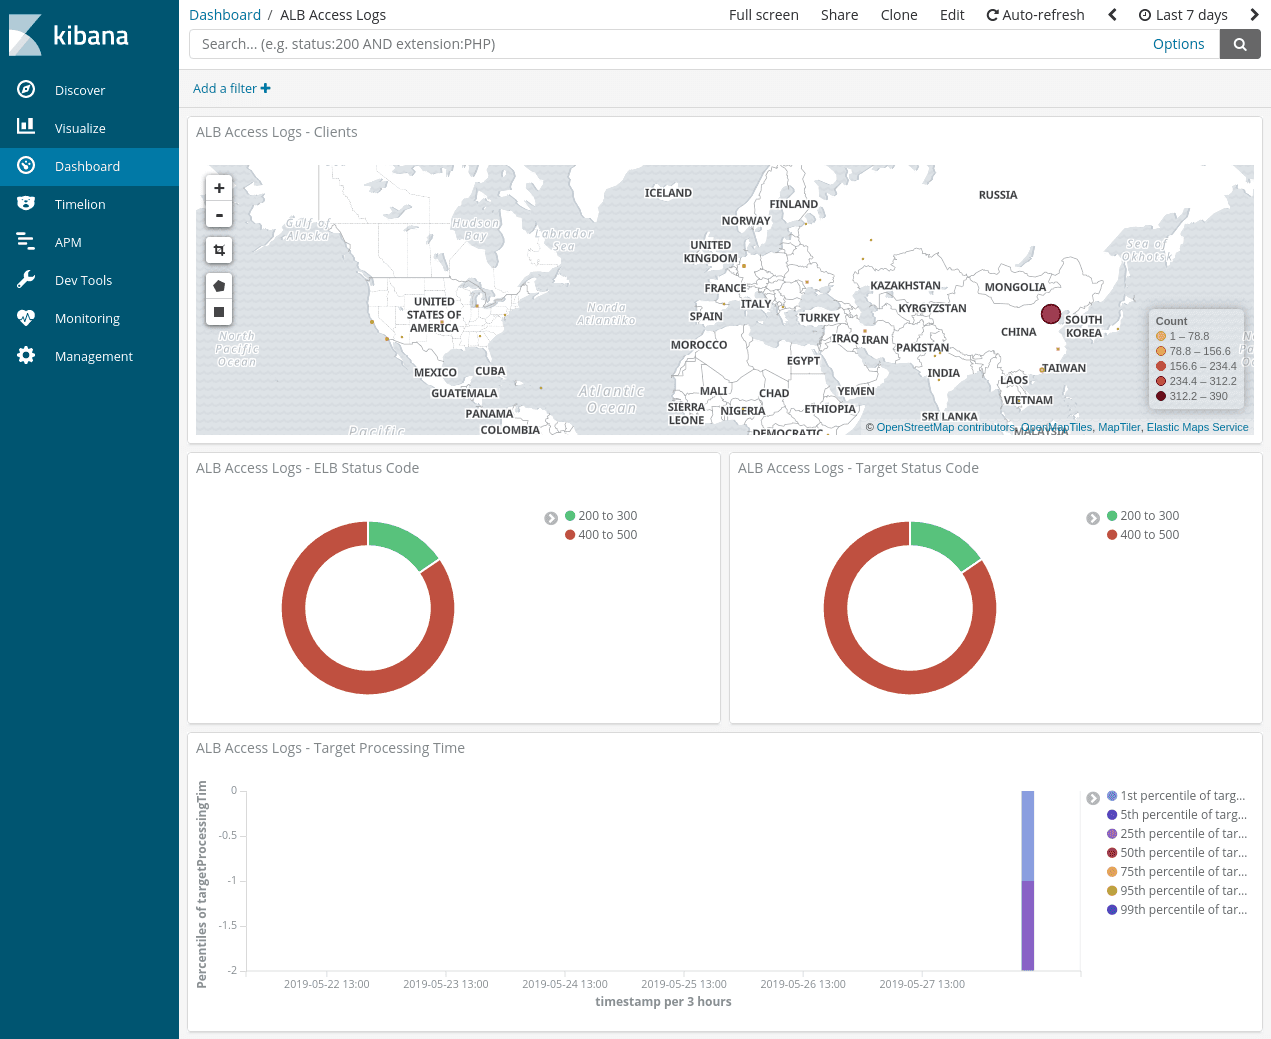
Viewing our data in Kibana
The accompanying repository also includes an example Kibana dashboard that you can import and play around with. It looks like this when filled with some dummy data:
Tips for ingestion success
-
Add CloudWatch alarms to your ingestion Lambda function for errors and run duration to make sure you’re not butting up against the timeout. The example Terraform configuration that’s in the Lambda code repo doesn’t have these setup!
-
Test the ingestion pipeline with some production-sized ALB logs to ensure the Lambda still runs OK with the memory and timeout you’ve given it.
-
As noted above, use the built-in CloudWatch metrics on status codes, response time and number of requests to alert you to avoid the lag between requests and access code logs. It may be convenient to use your existing ES alerting infrastructure, but this makes the ingestion pipeline a single point of failure in you getting these notifications and suffers from the aforementioned delays.