Finding a connection leak, the easy way

Finding a connection or memory leak can be difficult at the best of times and near-impossible without good visibility of what your application is doing. To make things worse, it’s easy to end up in production with something leaking that you may not have existing monitoring or metrics for. Adding this to the code might not be an option and can even temporarily hide the problem (or at least buy some time) but a redeployment is unlikely to get you closer to the root cause.
In a situation similar to the above, it’s important to understand exactly what is leaking and how this changes over time. You may be able to see that an application is slowly using up more of a resource but without a visual way of monitoring this, it’s extremely difficult to notice trends or spot outliers that indicate something’s wrong and this is especially hard when the transaction that causes the leak only happens occasionally. Speaking from bitter experience, finding a peak on a graph is much easier than running a command and noticing when a number changes.
Cheap & dirty metrics
While a time series database like Prometheus is excellent at tracking metrics and providing the functionality discussed in this article, it’s not always available (or a possibility, given the environment you’re working with). We can get around this by first examining exactly what is leaking.
In my most recent example, a process was leaking database connections.
As it’s a Linux machine, we can see the connection as an open file with the list
of open files (lsof) command.
sudo lsof -i -a -p 3136
In the above example, we’re looking for connections (-i) and (-a) we’re
only interested in the process with ID 3136 (-p 3136). This will yield an
output similar to the following.
COMMAND    PID  USER   FD   TYPE DEVICE SIZE/OFF NODE NAME
thunderbi 3136 james   35u  IPv4 219232      0t0  TCP jsj-box.int.jsherz.com:43162->65.55.174.170:imaps (ESTABLISHED)
thunderbi 3136 james   49u  IPv4  31665      0t0  TCP jsj-box.int.jsherz.com:37118->wo-in-f109.1e100.net:imaps (ESTABLISHED)
thunderbi 3136 james   53u  IPv4  31667      0t0  TCP jsj-box.int.jsherz.com:41062->40.101.46.210:imap (ESTABLISHED)
thunderbi 3136 james   55u  IPv4  31666      0t0  TCP jsj-box.int.jsherz.com:37120->wo-in-f109.1e100.net:imaps (ESTABLISHED)
thunderbi 3136 james   61u  IPv4  41738      0t0  TCP jsj-box.int.jsherz.com:60890->40.101.60.18:imap (ESTABLISHED)
Which can (roughly) be read as:
process pid user 35u IPv4 219232 0t0 TCP pc-name:port->other-pc-name:port (ESTABLISHED)
If you’d prefer to see IP addresses rather than hostnames, the -n option will
produce output similar to the following.
... TCP 10.0.0.101:39322->65.55.122.74:imaps (ESTABLISHED)
The -P option does the same for port numbers, preventing them from being
translated to the service name (e.g. imaps above).
... TCP jsj-box.int.jsherz.com:37118->wo-in-f109.1e100.net:993 (ESTABLISHED)
Once we have the above information, we can turn this data into a numeric value
that we can then track over time. In this case, I’m passing the output of lsof
to the wc command (word count) with it set to count lines (-l). Although
this doesn’t give us a true reading (it will count the header line), we’re
really only interested in how the value changes over time.
> sudo lsof -i -a -p 3136|wc -l
6
When we have a numeric value, we can use the watch command to retrieve this
information on a given time interval and combined with a short echo statement,
we can quickly build up a log file that tracks how our data point changes over
time. Although the above example is for open connections, you could measure
anything from memory usage to disk space in a particular folder.
# Get a unix timestamp
> date "+%s"
1487279164

# Combine it with the data point
> echo $(date "+%s"),$(sudo lsof -i -a -p 3136|wc -l)
1487279213,6

# Output the timestamp & data to a file, one line per entry
> echo $(date "+%s"),$(sudo lsof -i -a -p 3136|wc -l) >> /tmp/tracking.log

# And do so every five seconds
> watch -n 5 'echo $(date "+%s"),$(sudo lsof -i -a -p 3136|wc -l) >> /tmp/tracking.log'

# View the results
> tail /tmp/tracking.log
1487279261,6
1487279266,6
1487279271,6
Use the graphs, Luke
Now that we’ve got a file containing our data, we can use the excellent plotly library to ingest and display our data. There are many other alternatives for different languages (including plotly’s support of matplotlibb, R, python, JavaScript…) but I’ve always found Python great for little scripts like the one shown below.
The plotly documentation has a great number of examples that will show you various plotting methods, so I’ll skip straight to the code to save some time.
pip install plotly
#!/bin/env python

import csv
from plotly.offline import download_plotlyjs, init_notebook_mode, plot, iplot
from plotly.graph_objs import *
from datetime import datetime


source_file = '/tmp/tracking.log'
timestamps = []
data_points = []

#
# Read in our logged data
#

with open(source_file, 'r') as tracking_file:
    reader = csv.reader(tracking_file)

    for row in reader:
        timestamps.append(datetime.fromtimestamp(float(row[0])))

        # the number of open files is always a whole number in this example
        data_points.append(int(row[1]))

#
# Plotting magic!
#

plot({
    'data':  [Scatter(x = timestamps, y = data_points)],
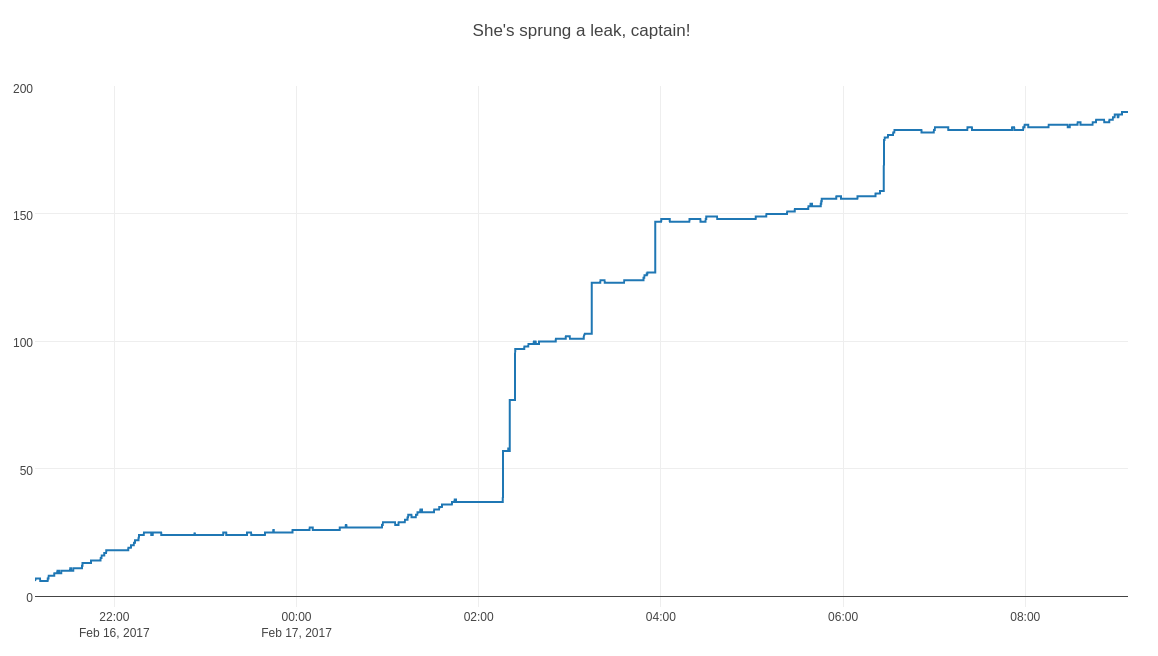
    'layout': Layout(title = 'She\'s sprung a leak, captain!')
})
With a bit of luck, your browser will open and display an interactive graph that looks something like the picture below. Unfortunately, I can’t share any real data so I used a small Python script to generate test values. You can have a play with the graph and data on the plotly website.

Finding the source of the leak
Once you’ve graphed your data as above, it becomes much easier to find when the leak happens and then tie that back to other events in your application. If you do find this kind of analysis useful, it’s definitely investing time in a technology that will collect and graph metrics in your application - hopefully before you need it!
In the database example, it often helps to view the last query that was run for
a connection, for example with the pg_stat_activity view in PostgreSQL. With
this information, you may be able to pin point which part of your application
is not closing the connection or is keeping it open while waiting for a resource
or deadlocked. A rare edge case or error scenario that raises an exception
(or your languages equivalent) is one place to look if you’re opening and
closing connections manually.
Good luck and happy hunting!