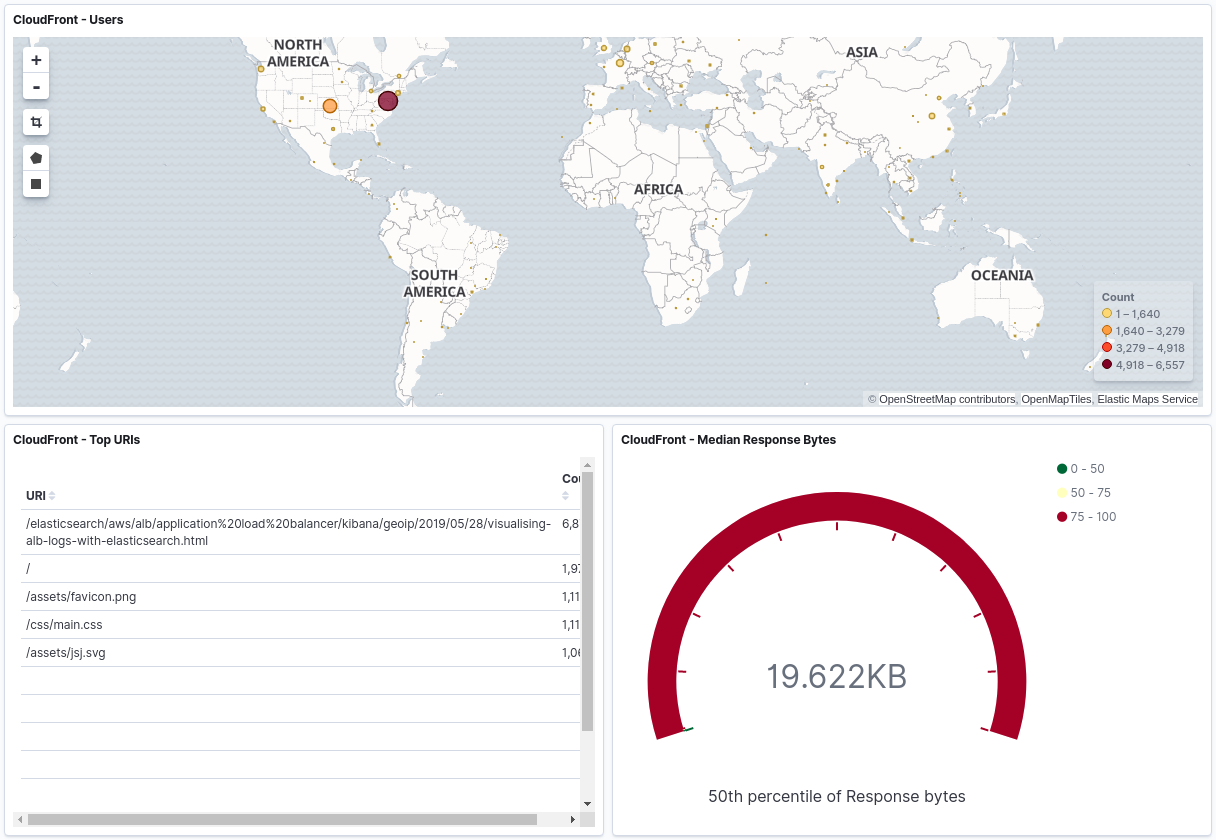
Analytics for CloudFront distributions
It’s nice to be able to analyse the traffic that your CloudFront distribution is receiving, for example if it powers a static website (like this blog). The built-in metrics aren’t very granular and don’t provide information like what browser the user visited the site with or where in the world they’re located. We can get this information from the distribution’s logs, but they’re in a gzipped text-based format and so aren’t much use on their own. Processing these logs and then storing them in Elasticsearch lets us search the data much more easily or even create visualisations, for example showing the most popular posts in any given week.
I wanted to have a go with the excellent Akka Streams library as I’d been learning it with the Rock the JVM course on Udemy, so I decided to write a small application that would take these files from an S3 bucket, parse them and then index the log records into Elasticsearch. This is a very similar method to the one used in my post on doing the same with Application Load Balancers however this application is a daemon that I’ll probably stick on a Raspberry Pi, rather than a Lambda function. The app has two modes: the first of which is to read all files in an S3 bucket and process them, used for the initial load in of historic data. The second mode runs continually and picks up messages on a Simple Queue Service (SQS) queue, notifying it that a new log file has been uploaded.
Check out the project on GitHub.
The net result? Your choice of pretty graphs. Is it relevant to see the median number of response bytes for requests? I’m not sure, but who doesn’t love a guage visualisation?!